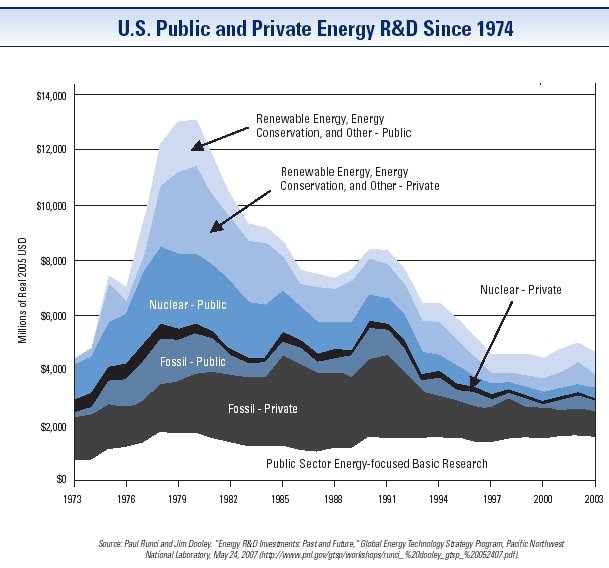
Investments into R&D SInce 1974 Source http://www.wrsc.org/sites/default/files/images/InvestmentsInRandDSince1… Category Nuclear Energy Renewable Energy Finance and Investments Level National Image Type Graph Geographic Area United States Read more about Investments into R&D SInce 1974
Fuel Cell Migration Path Source http://www.nfcrc.uci.edu/2/FUEL_CELL_INFORMATION/FCexplained/Challenges… Category Fuel Cells Costs Level National Image Type Graph Geographic Area United States Read more about Fuel Cell Migration Path
PV Penetration Model Source http://barrier-busting.com/wp-content/uploads/2008/09/doe-solar-pv-pene… Category Photovoltaic Cells Solar Energy Level National Image Type Graph Geographic Area United States Read more about PV Penetration Model
Solar Market Penetration Source http://www.deloitte.com/assets/Dcom-UnitedStates/Local%20Assets/Images/… Category Photovoltaic Cells Solar Energy Level National Image Type Graph Geographic Area United States Read more about Solar Market Penetration
Change in Ethanol Source http://www.afdc.energy.gov/afdc/ethanol/images/change_in_ethanol.gif Category Fuel Consumption Level National Image Type Graph Geographic Area United States Read more about Change in Ethanol
Number of People who Could be Fed by the US Grain used to Produce Ethanol Source http://s3.cleanersaferenergy.com/wp-content/uploads/2010/02/C_people.gif Number of People who Could be Fed by the US Grain used to Produce Ethanol Category Ethanol Energy Production Level National Image Type Graph Geographic Area United States Read more about Number of People who Could be Fed by the US Grain used to Produce Ethanol
What's the Real Cost of that $.99 Hamburger? Source http://www.zcommunications.org/FCKFiles/image/sep08zmoimages/Singer-Bur… Category Food Costs Level National Image Type Drawing/Diagram Geographic Area United States Read more about What's the Real Cost of that $.99 Hamburger?
US Energy-Related CO2 Emissions, 1950-2009 Source http://graphics8.nytimes.com/images/blogs/greeninc/epichart.jpeg Category Carbon Dioxide Emissions Level National Image Type Graph Geographic Area United States Read more about US Energy-Related CO2 Emissions, 1950-2009
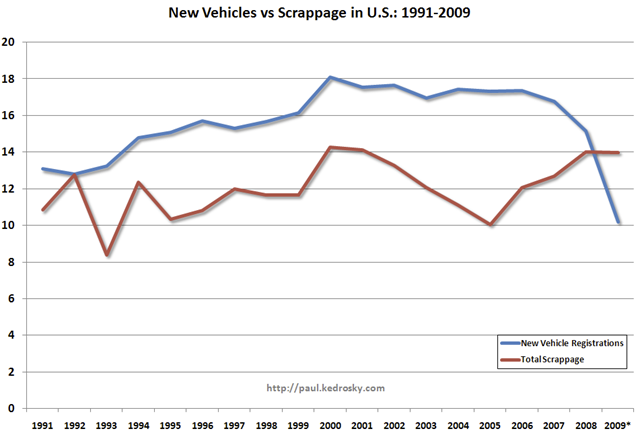
New Vehicles Vs. Scrappage in US, 1991-2009 Source http://static.seekingalpha.com/uploads/2010/1/6/saupload_peaks_cars_2.p… Category Motor Vehicles Level National Image Type Graph Geographic Area United States Read more about New Vehicles Vs. Scrappage in US, 1991-2009
Emissions Source wrsc.org Category Emission Reduction Level National Image Type Graph Geographic Area United States Read more about Emissions
