China Energy Flow Chart, 2005 Source http://farm5.static.flickr.com/4110/4974299749_d45a3f3395_b.jpg Category Energy Consumption Energy Production Energy Resources Energy Use Level National Image Type Flowchart Year 2005 Geographic Area China Read more about China Energy Flow Chart, 2005
Russian Wind Map at 80m Source https://ws99.myloadspring.com/sites/renew/Shared%20Documents/Country%20… Category Wind Energy Level National Image Type Map Geographic Area Russia Read more about Russian Wind Map at 80m
Russian Wind Map of Wind Speeds Above Mean 100m Source http://www.renewbl.com/wp-content/uploads/2010/07/russia-wind-map-vesta… Category Wind Energy Level National Image Type Map Geographic Area Russia Read more about Russian Wind Map of Wind Speeds Above Mean 100m
Developments in Russian Renewable Energy Developments in Russian Renewable Energy Category Renewable Energy Policy Level National Geographic Area Russia Read more about Developments in Russian Renewable Energy
India Population Map, 2006 Source http://earthsky.org/wp-content/uploads/2009/07/india_population_map_200… Category Population Growth Level National Image Type Map Year 2006 Geographic Area India Read more about India Population Map, 2006
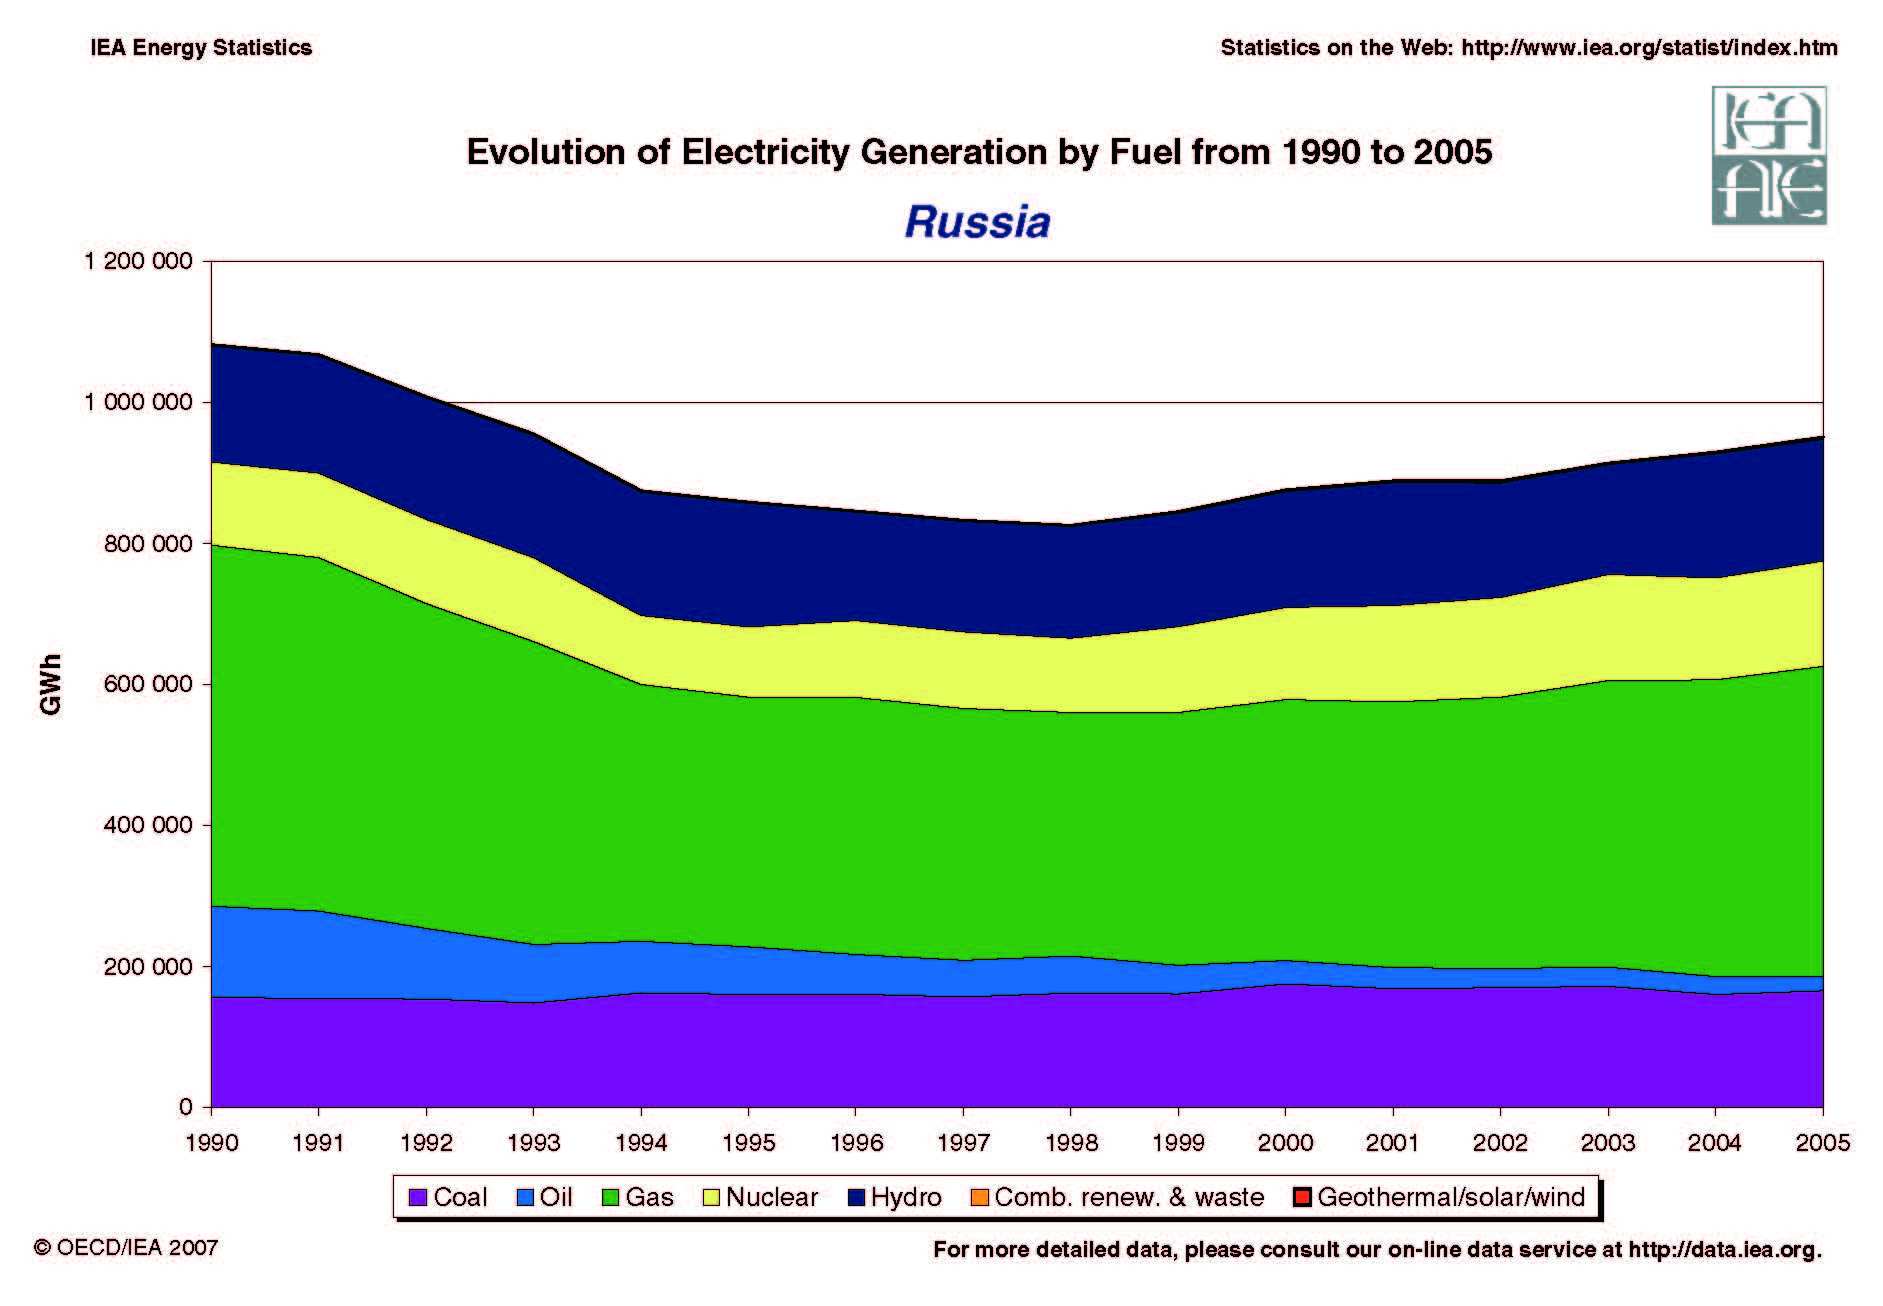
Evolution of Electricity Generation by Fuel, 1990-2005 Source http://www.geni.org/globalenergy/library/energy-issues/russia/graphics/… Category Electricity Generation Fuels Level National Image Type Graph Geographic Area Russia Read more about Evolution of Electricity Generation by Fuel, 1990-2005
US Capacity to Receive LNG Imports, 2000-2009 Source http://www.eredux.com/images/ereports/Gas.png Category Liquefied Natural Gas Level National Image Type Graph Geographic Area United States Read more about US Capacity to Receive LNG Imports, 2000-2009
United States Energy History Source http://www.eredux.com/images/leftsidepanel/302x180energyhistory.jpg Category Energy Resources Energy Use Level National Image Type Graph Geographic Area United States Read more about United States Energy History
United States Energy Mix Source http://bp1.blogger.com/_qZGouBqZeg8/SHwtHj6ZsyI/AAAAAAAAAU0/xw_orYsvx2U… Category Energy Resources Level National Image Type Pie Chart Year 2007 Geographic Area United States Read more about United States Energy Mix
China's Water Supply and Demand Gap Source http://greenleapforward.com/2010/01/06/charting-chinas-water-future/ Category Forecasts Water Demand Water Supply Level National Image Type Map Geographic Area China Read more about China's Water Supply and Demand Gap
